The Price and Donchian Channel
What is the Donchian Channel?
The Donchian Channel, or Price Channel as it is also know, is a trend indicator that was developed by Richard Donchian who is widely regarded as the farther of trend following. As with other bands and channels, such as the Bollinger Bands and Keltner Channels, the Donchian Channel is a price overlay that is drawn on the price chart where it plots the highest high and the lowest low a specified number of periods. The Donchian Channel can also be used to observe the volatility of a market as it widens and narrows as price volatility increases and decreases. This indicator formed the basis of the breakout system that was used to great effect by the famed Turtle Traders.
How is the Donchian Channel calculated?
The Donchian Channel or Price Channel essentially performs two calculations: it calculates the highest high over a specific look back period, and the lowest low over the same look back period. Some charting platforms also plot a center line in the channel, which is just an averaging of the highest high and the lowest low over the specified look back period. The default look back period for the Donchian Channel is 20. The formulae with the default value are:
Upper Channel Line = 20-period high
Lower Channel Line = 20-period low
Middle Channel Line = ( Upper Channel Line + Lower Channel Line ) / 2
How is the Donchian Channel used?
The Donchian Channel method identifies when price break through the high or the low of the specified look back period. When the price breaks through the upper channel line, it indicates the potential start of an uptrend and signals a long entry and the covering of any open short positions. When the price breaks through the lower channel line, it indicates the potential start of a down trend and signals a short entry and the closing of any long positions.
Some traders use the signals from the Donchian Channel as a stop-and-reverse, always-in-the-market system, switching from longs to shorts when the price breaks through the lower channel line, and switching from shorts to longs when the price breaks through the upper channel line. This, however, is not advisable as it does not allow for proper money management.
Chart Example
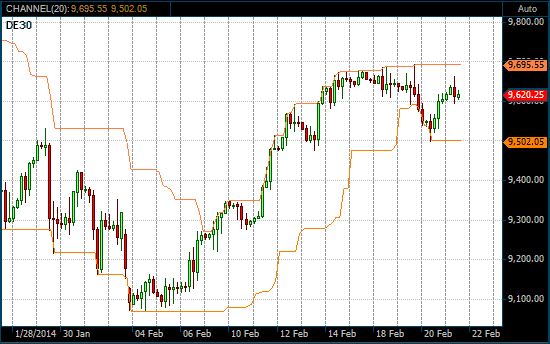
The following chart shows a 20-period Donchian Channel on a 4-hour DAX 30 Futures chart. The upper channel line tracks the highest high of the last 20 4-hour candlesticks while the lower channel line tracks the lowest low of the last 20 4-hour candlesticks.

20-period Donchian Channel on a 4 hour DAX Futures chart
At 8:00 on February 7, 2014, the price action broke through the upper channel line, signaling the start of an uptrend and a buy entry at 9,278. At 20:00 on 20 February the price action broke through the lower channel line, signaling the end of the uptrend and a start of a down trend. It was also a signal to close the long and enter a short at 9,581.