Basic Candlestick Chart Analysis
Japanese candlestick chart analysis begins with the reading or interpreting of single candlesticks. A single candlestick represents a single trading session or a trading period on a chart. This can be a 5-minute chart, an hour chart, a 4-hour chart, a daily chart, etc.
The Typical Candlestick
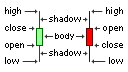
The candlesticks are drawn using four pieces of price data for the given time-frame, namely the High, the Low, the Open, and the Close. The distance from the Low to the High marks the trading range for the session, while the distance from the Open to the Close becomes the real body for that session. The real body is represented by a box that forms the candlestick while the difference between the Low and the real body as well as the High and the real body are represented by a line that forms the lower and upper shadows. The shadows are referred to as the price extremes and are often less important than the real body but they still convey important information.
If the Close is lower than the High, the box that is the real body of the candlestick takes a dark color but if the Close is higher than the Open, the real body takes a light color. This makes it easy to quickly identify when the session was bullish and closed up, and when it was bearish and closed down.
The Open and Close price levels that mark the upper and lower boundaries of the candlestick's real body are the important levels in Japanese candlestick chart analysis rather than the High and the Low. In other words, the real body of the candlestick is more important than the price range from High to Low.
Analyzing Single Candlesticks
A single candlestick is analyzed to understand the psychology behind the formation of that candlestick, and how that relates to the psychology behind the formation of the candlesticks that preceded it. This gives us insight to possible changes in the market's psychology and allows us to make decisions on whether to buy, hold, or sell. In Japanese candlestick chart analysis, there is often reference to a large (or a long) candlestick. A large candlestick has a real body that is at least twice the size of the average real body of the recent candlesticks.
Basic Candlestick Formation
The following are the basic formations of a candlestick:
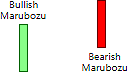
Marubozu Lines
- A candlestick that has no upper shadow it is said to have a shaven head while a candlestick that has no lower shadow is said to have a shaven bottom.
- A large candlestick, i.e., a candlestick with a real body that is at least twice the size of the average real body of the recent candlesticks, that has no upper shadow and no lower shadow is called a Marubozu.
- A large candlestick that has a shadow at the end where it opened but no shadow where it closed is said called a Closing Bozu.
- A large candlestick that has a shadow at the end where it closed but no shadow where it opened is said called an Opening Bozu.
- A candlestick that has its open and close at the same price level, or very close, is called a Doji. A Doji indicates indecision in the market during a session where the bulls and bears are in equilibrium.
- A candlestick that has no upper shadow, has a short real body, and a lower shadow that it at least twice the length of its real body is called an Umbrella line.
- A candlestick that has no lower shadow, has a short real body, and an upper shadow that it at least twice the length of its real body is called an Inverted Umbrella line.
Size, Color, and Location
Three properties on a single candlestick are interpreted in order to understand the psychology behind the formation that candlestick. These are the size of the candlestick, the color of its real body, and the location of the real body.
- The size of a candlestick's real body is important as it conveys the extent of the strength of the bears or the bulls.
- A large candlestick implies great strength in the price movement during that session. This candlestick has a real body that is at least twice the size of the average real body of the recent candlesticks.
- A small candlestick, on the other hand, represents session with a narrow price range. It is viewed as an insignificant candlestick that is indicative of a consolidating or indecisive market. A small candlestick is a candlestick with a less than average price range. It may or may not have shadows.
- The color of the candlestick is also important. It indicates whether the bulls or bears are in control during that trading session.
- A candlestick that is white or light-colored indicates that the strength lies with the bulls.
- A dark-colored candlestick, on the other hand, indicates that the bears are in control.
- If the candlestick has long shadows, the location of the candlestick's real body becomes significant. A long shadow refers to a shadow that is at least the same length of the real body. The shadow represents price extremes where the bears or the bulls managed to drive the price but were unable to maintain those price levels. A failure to retain those levels are seen as weakness.
- When the real body of a bullish, light colored candlestick is located at the bottom end of the candlestick, with a long upper shadow, it is seen as a weak bullish candlestick as the bears were able to drive the price down from its High.
- When the real body of a bullish candlestick is located at the top end of the candlestick, with a long lower shadow, it is seen as a stronger bullish candlestick as the bulls were able to drive the price up significantly from its Low.
- When the real body of a bearish, dark colored candlestick is located at the top end of the candlestick, with a long lower shadow, it is seen as a weak bearish candlestick as the bulls were able to drive the price up from its Low.
- When the real body of a bearish candlestick is located at the bottom end of the candlestick, with a long upper shadow, it is seen as a stronger bearish candlestick as the bears were able to drive the price significantly down from its High.
- When the real body of the candlestick is located at the middle of the candlestick, with a long upper and lower shadows, it is seen more as a neutral.
Analyzing Candlesticks in Context
Understanding the message that a single candlestick conveys is the starting point of Japanese candlestick chart analysis. The next step is to understand the candlestick in the greater context of the candlesticks that came before it. For example, a small candlestick is usually viewed as insignificant, but this can change when it appears directly after a large candlestick as it indicates a switch from strength to weakness. In this scenario, the smaller the candlestick, the greater the contrast between the strength illustrated by the previous candlestick and weakness illustrated by the small candlestick. Thus, a smaller candlestick becomes more significant in this context; and more so if it has a small real body.
Another dimension that is added by context is the midpoint of the previous candlestick's real body. When a bearish candlestick appears after a large bullish candlestick it is seen as the bears counterattacking the bulls. This is where the midpoint of the bullish candlestick becomes significant. It the bearish candlestick fails to close below the midpoint of the previous candlestick; it is seen as a failure and the next candlestick becomes an important battlefield. If the bearish candlestick does close above the midpoint of the previous candlestick, then the bears have the upper hand. The next candlestick is still important, unless the bearish candlestick closed above the real body of the previous candlestick. Then the bears are fully in control.