Williams' %R (Wm%R)
What is it?
The Williams' %R (Wm%R) is a leading momentum and trend indicator that was developed by Larry Williams in 1973. It is similar to the Stochastic Oscillator but indicates the strength of a trend by measuring where the latest price closes in relation to the high and the low of the price range over a specified period. If the price closes nearer the high of the range for the specified period, then the trend is bullish; if the price closes nearer the low, then the trend is bearish. However, Wm%R is plotted as a negative percentage that oscillates between 0% and -100% with 0% indicating that the latest price close is at the high of the range; and -100% indicating that the latest price close is at the low of the range.
How is it calculated?
Williams' %R is calculated in two steps. First subtract the latest price close from the high of the range for the period and divide it by the difference between the high and the low for the range of the period. The multiply the result by -100. The result is a negative percentage. The formula is:
%R = -100 x ( High of range - Latest close ) / ( High of range - Low of range )
where the range is the specified period. The default period for the range is 14.
How is it used?
William's %R gives three different trading signals: divergence; swing failures; and overbought and oversold conditions.
For the Wm%R the -20 line and the -80 line represents the overbought and oversold areas respectively. Thus, when the Wm%R is above -20, the underlying security is generally considered overbought and when it is below -80, the underlying security is considered oversold. When the Wm%R moves down over the -20 line it signals that a drop in the price of the underlying security is probable and when the Wm%R moves up over the -80 line is indicates that there is a good probability that the price of the underlying security will increase. However, as the Wm%R is a leading indicator, these signals may be premature and are usually less reliable in a strong trend. In a strong trend these signals are a warning of impending change rather than entry signals. However, some traders prefer -10 and -90 as the reference lines for the overbought and oversold areas.
The Wm%R usually moves from an oversold area to an overbought area and vice versa. A failure swing occurs when the Wm%R moves from an overbought or oversold area but turns back before reaching the other area. When the Wm%R fails to reach the overbought area, it indicates a weakness in the uptrend and the probability that the trend will reverse. This would be a signal to close of any long positions; or a signal to sell short. Similarly, when the Wm%R fails to reach the oversold area, it indicates that the downtrend is weak and that it may reverse soon. This signals that you should cover any short positions or go long.
Bearish divergence occurs when the price makes a higher high but the Wm%R makes a lower high. This indicates that there is a weakness in the uptrend and that a trend reversal is likely. A bullish divergence occurs when the price makes a lower low but the Wm%R makes a higher low. Here again, weakness in the trend is alluded to with a strong probability that the trend will reverse soon. Bearish divergence is more significant when the higher peak is in the overbought area (generally above -20) and the lower peak is below the overbought area. Similarly, the bullish divergence is more significant when the lower valley is in the oversold area (generally below -80) and the subsequent valley is above the oversold area.
Chart Example
The following chart shows a 14-period Wm%R in the lower chart panel on a 4-hour futures chart of the Dow Jones Industrial Index (DJI).
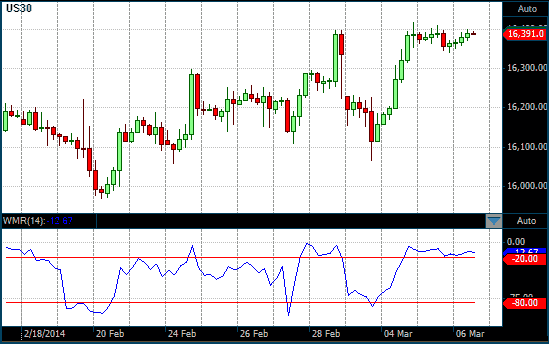
14-period Wm%R on a 4-hour DJI Futures chart