Stochastic Oscillator
What is it?
The stochastic oscillator is a leading momentum indicator that was developed by George Lane. It consists of two lines – the %K and the %D – which fluctuate between 0 and 100. The %K line represents the change in closing price with respect to the high and low of the specified period while the %D line is the average of the fast %K over another specified period. The periods suggested by Lane for the %K and the %D are 14 for the %K line and 3 for the %D line, though some traders use 9 for the %K line and 5 for the %D line.
The stochastic oscillator is used to determine when closing prices cluster together in the retraction of a developed trend in an attempt to identify potential entry and exit points.
How is it calculated?
To calculate the stochastic oscillator you need to calculate both the %K line followed by the %D line.
First, the %K line is calculated by subtracting the latest closing price (CP) from the lowest closing price for the period and dividing it by the difference of the high and low closing prices for the period. The formula is:
( Latest CP - Lowest CP ) / ( Highest CP - Lowest CP )
Next, the %D line is calculated by averaging the %K values for the period of the %D line. This is calculated by averaging the sum of the %K values for the period of the %D and dividing it by the period of the %D. The formula is:
( %K + %K + ... n ) / n
where n is the period of the %D line. If the standard 3 period %D line is used, then it is the sum of the last three %K values divided by 3.
How is it used?
There are a number of ways in which the stochastic oscillator can be used. Extreme readings occur when the faster moving %K line nears 100 or 0. When the %K line is near 100, the security is thought to be overbought and when it is near 0, the security is thought to be oversold. However, the security can remain overbought or oversold for a while.
More reliable entry and exit signal are generated when the %K line crosses the slower moving %D line when in the overbought or oversold area. This indicates an imminent reversal in the short-term trend. Thus, a potential entry signal is generated when the %K line crosses over the %D line in a oversold condition, i.e., when the stochastic oscillator is below 20, and a potential exit signal is generated when the %K line crosses over the %D line in a overbought condition, i.e., when the stochastic oscillator is above 80.
As with other oscillators, positive and negative divergence between the stochastic oscillator and the security occurs. That is when peaks on the price chart and the stochastic oscillator trend lines slope in different directions. When divergence occurs, a potential price reversal may follow.
Finally, George Lane also referred to a flattened %K or %D line as hinges, stating that a hinge may indicate that the current trend has become exhausted, and that the potential for a price reversal is great.
Chart Example
The following chart shows a 10,3,3 Stochastic oscillator in the lower chart panel on a 30-minute chart of the Dow Jones Industrial Index. The blue line is the raw stochastics while the red dashed line is the smoothed signal line.
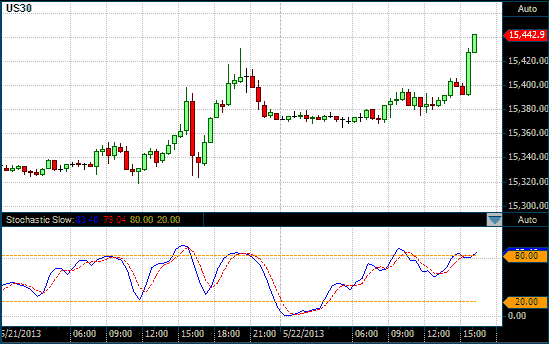
Stochastic oscillator on a 30 Minute DOW chart