Money Flow Index (MFI)
What is it?
The Money Flow Index (MFI) is an oscillating momentum and market strength indicator that was developed by Gene Quong and Avrum Soudack. It is also a leading indicator, which means it tends to lead price action, and is similar in calculation as J. Welles Wilder's Relative Strength Index (RSI) with the significant difference being that the MFI uses both price and volume, a trait it has in common with the Chaikin Money Flow (CMF) indicator. In fact, the CMF is often described as a volume-weighted RSI. Like the RSI, the MFI is a range-bound oscillator that oscillates between zero and 100 and is interpreted in a similar way as the RSI.
The ultimate aim of the MFI is to determine whether money is flowing in or out of a security over a specified look-back period, with the default being 14 days or periods. As a general rule, when the MFI indicator rises, it implies that there is buying pressure as money is flowing into the security and when the indicator drops, it implies that there is selling pressure as money is flowing out of the security.
How is it calculated?
The calculation for the MFI is rather complex and consists of a number of steps:
First, calculate the Typical Price (TP) for each period that makes up the look-back period using the formula:
Typical Price = ( High + Low + Close ) / 3
Second, calculate the Raw Money Flow for each period by multiplying the Typical Price of each period by the volume of that period:
Raw Money Flow = Typical Price x Volume
Third, calculate the Positive Money Flow for the look back period by calculating the sum the positive Raw Money Flow values:
Positive Money Flow = Sum of positive Raw Money Flow over look-back period
Fourth, calculate the Negative Money Flow for the look back period by calculating the sum the negative Raw Money Flow values:
Negative Money Flow = Sum of negative Raw Money Flow over look-back period
Fifth, calculate the Money Flow Ratio for the look back period by dividing the Positive Money Flow by the Negative Money Flow:
Money Flow Ratio = Positive Money Flow / Negative Money Flow
Finally, calculate the MFI using the formula:
MFI = 100 – 100 / ( 1 + Money Flow Ratio )
The result is a range-bound line that oscillates between zero and one hundred.
How is it used?
The MFI oscillates between 0 and 100 and a security is considered overbought when its MFI rises above 80 and oversold when its MFI falls below 20. These levels are the suggested overbought and oversold levels as suggested by Quong and Soudack, though they do not suggest these levels as entry signals. Instead, these caution levels warn that the price action and the current trend have reached extremes that may be unsustainable. Quong and Soudack also recommend using the 90 and 10 lines as truly overbought and truly oversold levels respectively. MFI movements above 90 and below 10 are rare and indicate a higher level of unsustainability.
Divergence can be used to generate trading signals in anticipation of trend reversals. Bearish divergence occurs when the price makes a higher high while the MFI makes a lower high. This indicates that there is a weakness in the uptrend and that a trend reversal is likely. A bullish divergence occurs when the price makes a lower low but the MFI makes a higher low. Here again, weakness in the trend is alluded to with a strong probability that the trend will reverse soon.
Finally, failure swings from the 20 or 80 levels can also be used to identify potential price reversals and trade entries. A failure swing occurs when the MFI moves over the overbought or oversold level but reverses back before reaching the opposite level. Thus, when the MFI crosses up over the 20 (oversold) level but reverses before it reaches the 80 (overbought) level, it indicates that the uptrend is weak and that it may reverse soon. This signals that you should cover any long positions or go short. Similarly, when the MFI crosses down over the 80 (overbought) level but reverses before it reaches the 20 (oversold) level, it indicates a weakness in the down trend and the probability that the trend will reverse. This would be a signal to close of any short positions; or a signal to long buy.
Chart Example
The following chart shows a 14-period MFI in the lower chart panel on a 15-minute chart of the S&P500 Futures Index. The chart indicates bullish divergence on the afternoon of November 26, 2013.
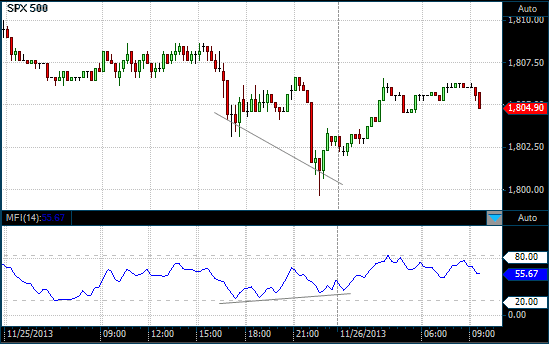
MFI on a 15 Minute S&P500 Futures chart