Aroon Indicator
What is it?
The Aroon indicator is a trend indicator that is similar J Welles Wilder's Directional Movement Index (DMI). It was developed by Tushar Chande and was first published in the September 1995 issue of Technical Analysis of Stocks & Commodities magazine. The name is derived from the Sanskrit word "aroon", which translates into "dawn's early light", and describes the Aroon indicator fittingly as the indicator attempts to identify a new trend early in its formative stage. The Aroon indicator accomplishes this by plotting two lines that indicate the strength of a trend:
- The Aroon Up, which measures the number of bars since the underlying security made a new high for the period, and
- The Aroon Down, which measures the number of bars since the underlying security made a new low for the period.
Both the Aroon Up and the Aroon Down oscillates between 0 and 100. When the Aroon Up or the Aroon Down line is close to 100 it indicates a strong up or down trend, depending on which line is near 100 and when either line is near zero it indicates a weak up or down trend, again, depending on which line is near zero.
How is it calculated?
As the Aroon indicator consists of two lines; the calculation consists of two separate parts that follow similar steps. The Aroon Up is calculated in relation to the amount of time within the look-back period since that last price high while the Aroon Down is calculated in relation to the amount of time within the look-back period since that last price low. Both calculations are converted to a percentage by multiplying the result by 100.
The formula for the Aroon Up is:
( ( n - Period Since n Period High ) / n ) x 100
The formula for the Aroon Down is:
( ( n - Period Since n Period Low ) / n ) x 100
In both formulae, n is the look-back period for the indicator.
How is it used?
The Aroon indicator can be used in one of two ways: using signal levels to extreme readings, and using cross-over.
When either of the Aroon Up or the Aroon Down lines is above the 70 line, it indicates that there is a strong trend in the direction of the line that is above 70. Conversely, when either of the Aroon Up or the Aroon Down lines is below the 30 line, it indicates that there is a weak trend in the direction of the line that is below 30. Also, when either of the Aroon Up or the Aroon Down lines crosses down over the 50 line, it indicates that the trend in the direction of the line that is crossing down is losing its momentum.
When the Aroon Up line crosses up over the Aroon Down line, it indicates the possible establishment of an uptrend, especially when that occurs between the 30 and 70 lines. Conversely, when the Aroon Down line crosses up over the Aroon Up line, it indicates the possible establishment of a downtrend.
When the Aroon Up and Aroon Down lines are both below the 50 line, or both are moving down parallel to each other, it indicates a period of consolidation when there is no clear trend emerging.
The Aroon indicator can also be used in conjunction with the Aroon Oscillator, which basically plots the difference between the Aroon Up and the Aroon Down.
Finally, the Arron indicator can also be used in breakout systems. When the Aroon Up line moves above the 70 line it is a potential buy signal and when the Aroon Down line moves above the 70 line it is a potential sell signal.
Chart Example
The following chart shows a 14-period Aroon indicator in the lower chart panel on a 30-minute chart of the Dow Jones Industrial Index. The red line is the Aroon Up line and the blue dashed line is the Aroon Down line.
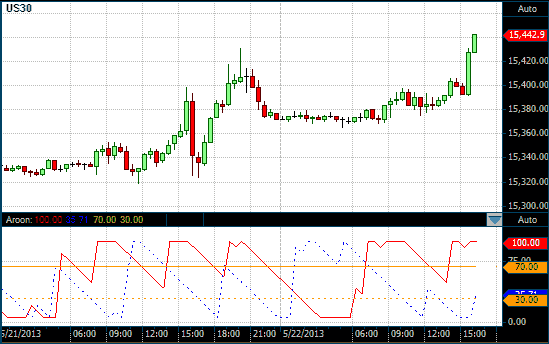
Aroon on a 30 Minute DOW chart