Andrews' Pitchfork or Median Lines
What is it?
Andrew's Pitchfork, which is also known as Median Lines, is a support and resistance indicator that was developed by a Thermodynamics Professor at MIT, named Dr. Alan Andrews, in the 1970s. It uses three parallel trend lines based on three alternating pivots to identify possible support and resistance levels.
How is it calculated and drawn?
The trendlines are created by placing three points at three consecutive peaks or troughs, or pivot highs and lows, at the start of a trend. A straight line is then drawn from the first point, intersecting the midpoint or the median of the other two points. For this reason, Andrews' Pitchfork is also called "median line studies". Parallel, equidistant lines are then drawn from the second and third points. The result is a trend channel with a median line in the middle.
Most modern charting software packages include Andrew's Pitchfork as a drawing tool that is applied to the price chart, though it might be called Median Lines on some charting software packages.
How is it used and interpreted?
As with any other channel, the outer trend lines mark potential support and resistance levels. The prevailing trend is said to remain intact as long as the Pitchfork channel is not violated and a trend reversal is said to occur when prices break out of a Pitchfork channel against the direction of the trend.
Thus, in an uptrend, the lower trend line acts as support and the upper trend line acts as resistance, while the median line determines the continued strength of the trend. The price movement of the underlying security should move from the lower trend line and reach the median line on a regular basis during an uptrend. If the price fails to reach the median line, it implies that there is weakness in the trend that could foreshadow a trend reversal. This reversal would occur when the price movement breaks support, i.e., when it breaks below the lower trend line. Once the support line is broken, it could act as a resistance line. The reverse is true for a down trend.
Chart Example
The following is a 4-hour chart of the Euro/USD with an Andrews' Pitchfork drawn from three pivots that mark the start of the current down trend starting with the last swing high made on May 1, 2013.
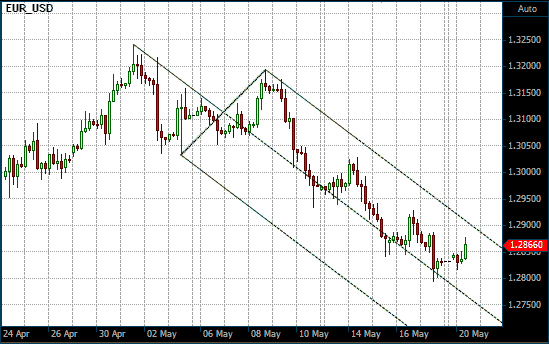
Andrews' Pitchfork on a 4 Hour Euro/USD chart