Fibonacci Price Projections
What is it?
Fibonacci price projections is another support and resistance indicator that uses Fibonacci ratios to analyze price movements and identify potential support and resistance levels. It however differs from Fibonacci price retracements and Fibonacci price extensions in that it performs a proportional study of the current price swing in relation to a previous swing in the same direction. As with other Fibonacci studies, the proportions used in Fibonacci projection studies are based on the mathematical relationships, expressed as ratios, between the numbers in the Fibonacci summation series.
Some charting applications have this tool labeled as Fibonacci Expansions.
How is it calculated?
As with other Fibonacci studies, the key Fibonacci projection levels are found by performing mathematical operations on the numbers in the Fibonacci summation series, and on the results of those operations. The same levels used in Fibonacci price extensions are used in Fibonacci projections:
- The first ratio of 161.8%, which is the "golden ratio" or the "golden mean", is found by dividing a number in the sequence by the number that precedes it. For example: 21 ÷ 13 = 1.6154, 34 ÷ 21 = 1.6190 and 55 ÷ 34 = 1.6176.
- The 261.8% ratio is found by dividing a number in the sequence by the number that appears two places before it. For example: 34 ÷ 13 = 2.425, 55 ÷ 21 = 2.619 and 144 ÷ 55 = 2.61818. It is also the square of 1.618 (1.618 x 1.618 = 2.618).
- The 423.6% ratio is found by dividing a number in the sequence by the number that appears three places before it. For example: 55 ÷ 13 = 4.2308, 89 ÷ 21 = 4.2381 and 144 ÷ 34 = 4.2353. It is also the sum of 1.618 and 2.618 (1.618 + 2.618 = 4.236).
- In addition to these three ratios, the 127.2% extension level is also used. This level is the square root of 1.618 (√1.618 = 1.272).
- Some traders also use the 61.8% Fibonacci ratio, which is the inverse of the 161.8% ratio.
How is it used?
The application of Fibonacci projections differ from other studies in that two price waves are required: an initial wave and a completed wave in the counter direction. The Fibonacci price projection is then projected from the end of the counter trend move.
When using Fibonacci projections, the technical analyst waits for the market to turn and then applies the Fibonacci projection ratios on the price wave that preceded the last movement. This study is then projected from the end of the last price swing. This requires three points: a previous swing high and swing low followed by another swing high in a down trend, or a previous swing low and swing high followed by another swing low in an uptrend. The Fibonacci ratios are applied to the swing high to swing low in a down trend and projected from the next swing high, or from the swing low to swing high in an uptrend and projected from the next swing low. Horizontal lines are then drawn at these levels and are used a possible support or resistance levels.
Multiple Fibonacci projections can also be drawn by applying the Fibonacci ratios to different price waves in the same direction and projecting those studies to the start of a price movement in the direction. This creates multiple levels with areas were two or more Fibonacci levels are in close proximity being more significant.
Chart Example
The following chart shows a Fibonacci Price Projection on daily chart of the GBP/USD. The initial price study is taken from the swing low made on August 2, 2013 to the swing high made on August 21, 2013. The resulting levels are then projected to the next swing low that was made on August 28, 2013. Notice how the subsequent rally has already met resistance twice at the 127.2% projection level. This may have been a good level to take profit.
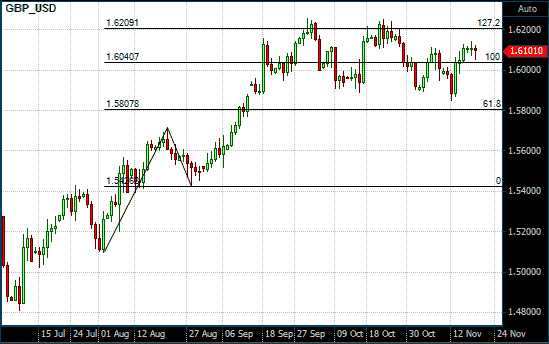
Fibonacci Projection on a Daily GBP/USD chart