Fibonacci Fans
What is it?
Fibonacci fans are based on the same principles as Fibonacci retracements but have more in common with Gann lines and Speed Resistance Lines (SRL). As with Fibonacci retracements, Fibonacci fans is based on the mathematical relationships between the numbers in the Fibonacci sequence. However, Fibonacci fans plot trend lines rather than support and resistance lines.
How is it calculated?
The Fibonacci fan lines are determined by applying the key Fibonacci ratios to the significant high and low points that mark the start of a trend. The key Fibonacci ratios are determined by dividing a number in the sequence with another number that follows it. Thus:
- The first ratio of 61.8%, which is the inverse of "golden ratio" or the "golden mean" (i.e., the inverse of 1.61%), is found by dividing a number in the sequence by the number that immediately follows it. For example: 8 ÷ 13 = 0.6153, 34 ÷ 55 = 0.6182 and 55 ÷ 89 = 0.6179.
- The 38.2% ratio is found by dividing a number in the sequence by the number that follows two places to the right of it. For example: 8 ÷ 21 = 0.3809, 21 ÷ 55 = 0.3818 and 55 ÷ 144 = 0.3819. It is also found by subtracting 0.618 from 1 (1 – 0.618 = 0.328).
- And the 23.6% ratio is found by dividing a number in the sequence by the number that follows three places to the right of it. For example: 8 ÷ 34 = 0.2352, 21 ÷ 89 = 0.2359 and 34 ÷ 144 = 0.2361. It is also found by subtracting 0.382 from 0.618 (0.618 – 0.382 = 0.236).
- In addition to these three ratios, some traders also use a 50% ratio. Although this is not a Fibonacci ratio, it still appears to be a significant level that the price movement adheres to.
Once the start of the trend has been identified the range from the significant high and low that marks the start of the trend is divided by these Fibonacci ratios and lines are drawn through these points, starting from the high if the current trend is a down trend or the low if the current trend is an uptrend.
How is it used?
Like other support and resistance indicators, Fibonacci fans is based on the principle that the market will retrace a portion of the previous movement before continue in the direction of the trend. This is based on the fact that the financial markets do not trend in a straight line. Instead the trend is interrupted by retracements that tend not to exceed the previous wave.
When using Fibonacci fans, a technical analyst divides the previous wave in the direction of the trend by the Fibonacci ratios mentioned above. Trend lines are then drawn from the starting point through these levels and are used as possible support levels if the larger trend is an uptrend, or as possible resistance levels if the larger trend is a down trend. These thus become places at which the trader could buy in a larger uptrend or sell in a larger down trend.
Chart Example
The following is a 15-minute chart of the GBP/USD with a Fibonacci Fan drawn from low at 12:15 on May 20, 2013 to the high made later that day at 21:00. Notice how the subsequent retracement initially met support at the 38.2% and then again at the 61.8% line, and how once broken, the 50% support line became resistance to further buying.
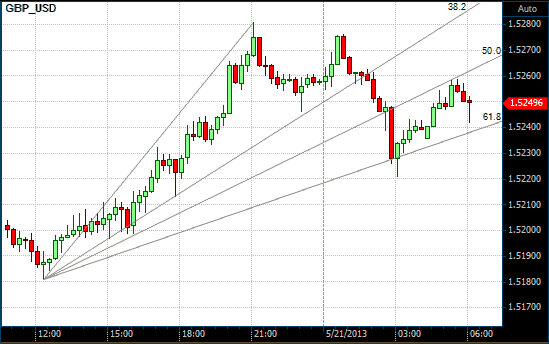
Fibonacci Fan on a 15 Minute GBP/USD chart